
FASTQ files
FASTQ files are the foundation of next-generation sequencing analysis. Understanding how to interpret these scores, and when to apply trimming, is essential for ensuring accurate downstream analyses in genomics and bioinformatics.
What is a FASTQ?
A FASTQ file stores DNA/RNA reads and their per-base quality. There is always at least one FASTQ file. If the experiment was paired-end, there will be two files (R1 and R2). If it was single-end, there will be only one (R1).
Each read takes up 4 lines:
- Read ID
- Sequence (A/C/G/T/N)
- Separator (+)
- Quality: a string of ASCII characters, one per base, encoding the Phred score (base-calling confidence)
**FASTQ files are almost always delivered compressed as .fastq.gz.
EXAMPLE
@A00469:123:HGF2KDSXX:1:1101:10003:12345 1:N:0:ACGTAC
ACGTTCTGATGACCTTAGCA
+
IIHFGEFIIHDF>?=;:987
- Line 1: Identifier (instrument, run, coordinates, etc.). The 1 before :N: indicates R1 (if it were 2, it would be R2).
- Line 2: Sequence (20 bases in this example).
- Line 3: Separator (+).
- Line 4: Per-base quality, same length as the sequence (20 characters).
How to interpret per-base quality?
It is related to the probability of error P as follows:
The Phred quality score Q is defined as:
Q = -10 · log10(P) ⇒ P = 10-Q/10
- Q10: 1/10 error rate (90% confidence)
- Q20: 1/100 (99%)
- Q30: 1/1000 (99.9%)
- Q40: 1/10,000 (99.99%)
Example of step-by-step interpretation
ACGTTCTGATGACCTTAGCA
IIHFGEFIIHDF>?=;:987
| Pos | Base | Char | ASCII | Q (Phred) | P(error) aprox. | Interpretation |
|---|---|---|---|---|---|---|
| 1 | A | I | 73 | 40 | 0.0001 (0.01%) | Extremely reliable |
| 2 | C | I | 73 | 40 | 0.0001 | Extremely reliable |
| 3 | G | H | 72 | 39 | 0.00013 | Very reliable |
| 4 | T | F | 70 | 37 | 0.0002 | Very reliable |
| 5 | T | G | 71 | 38 | 0.00016 | Very reliable |
| 6 | C | E | 69 | 36 | 0.00025 | Very reliable |
| 7 | T | F | 70 | 37 | 0.0002 | Very reliable |
| 8 | G | I | 73 | 40 | 0.0001 | Extremely reliable |
| 9 | A | I | 73 | 40 | 0.0001 | Extremely reliable |
| 10 | T | H | 72 | 39 | 0.00013 | Very reliable |
| 11 | G | D | 68 | 35 | 0.00032 | Reliable |
| 12 | A | F | 70 | 37 | 0.0002 | Very reliable |
| 13 | C | > | 62 | 29 | 0.0013 (0.13%) | Acceptable |
| 14 | C | ? | 63 | 30 | 0.001 (0.1%) | Acceptable |
| 15 | T | = | 61 | 28 | 0.0016 (0.16%) | Moderada |
| 16 | T | ; | 59 | 26 | 0.0025 (0.25%) | Moderada |
| 17 | A | : | 58 | 25 | Moderate–low | Moderate–low |
| 18 | G | 9 | 57 | 24 | 0.004 (0.4%) | Low-moderate |
| 19 | C | 8 | 56 | 23 | 0.005 (0.5%) | Low |
| 20 | A | 7 | 55 | 22 | 0.0063 (0.63%) | Low |
Global Interpretation
- Beginning of the read (positions 1–10): very high quality scores (Q37–40), virtually error-free.
- Middle region (11–14): quality decreases slightly (Q29–35), still acceptable.
- End of the read (15–20): quality drops considerably (Q22–28), with an expected error rate of 0.1–0.6%: this is where Illumina sequencers typically show issues.
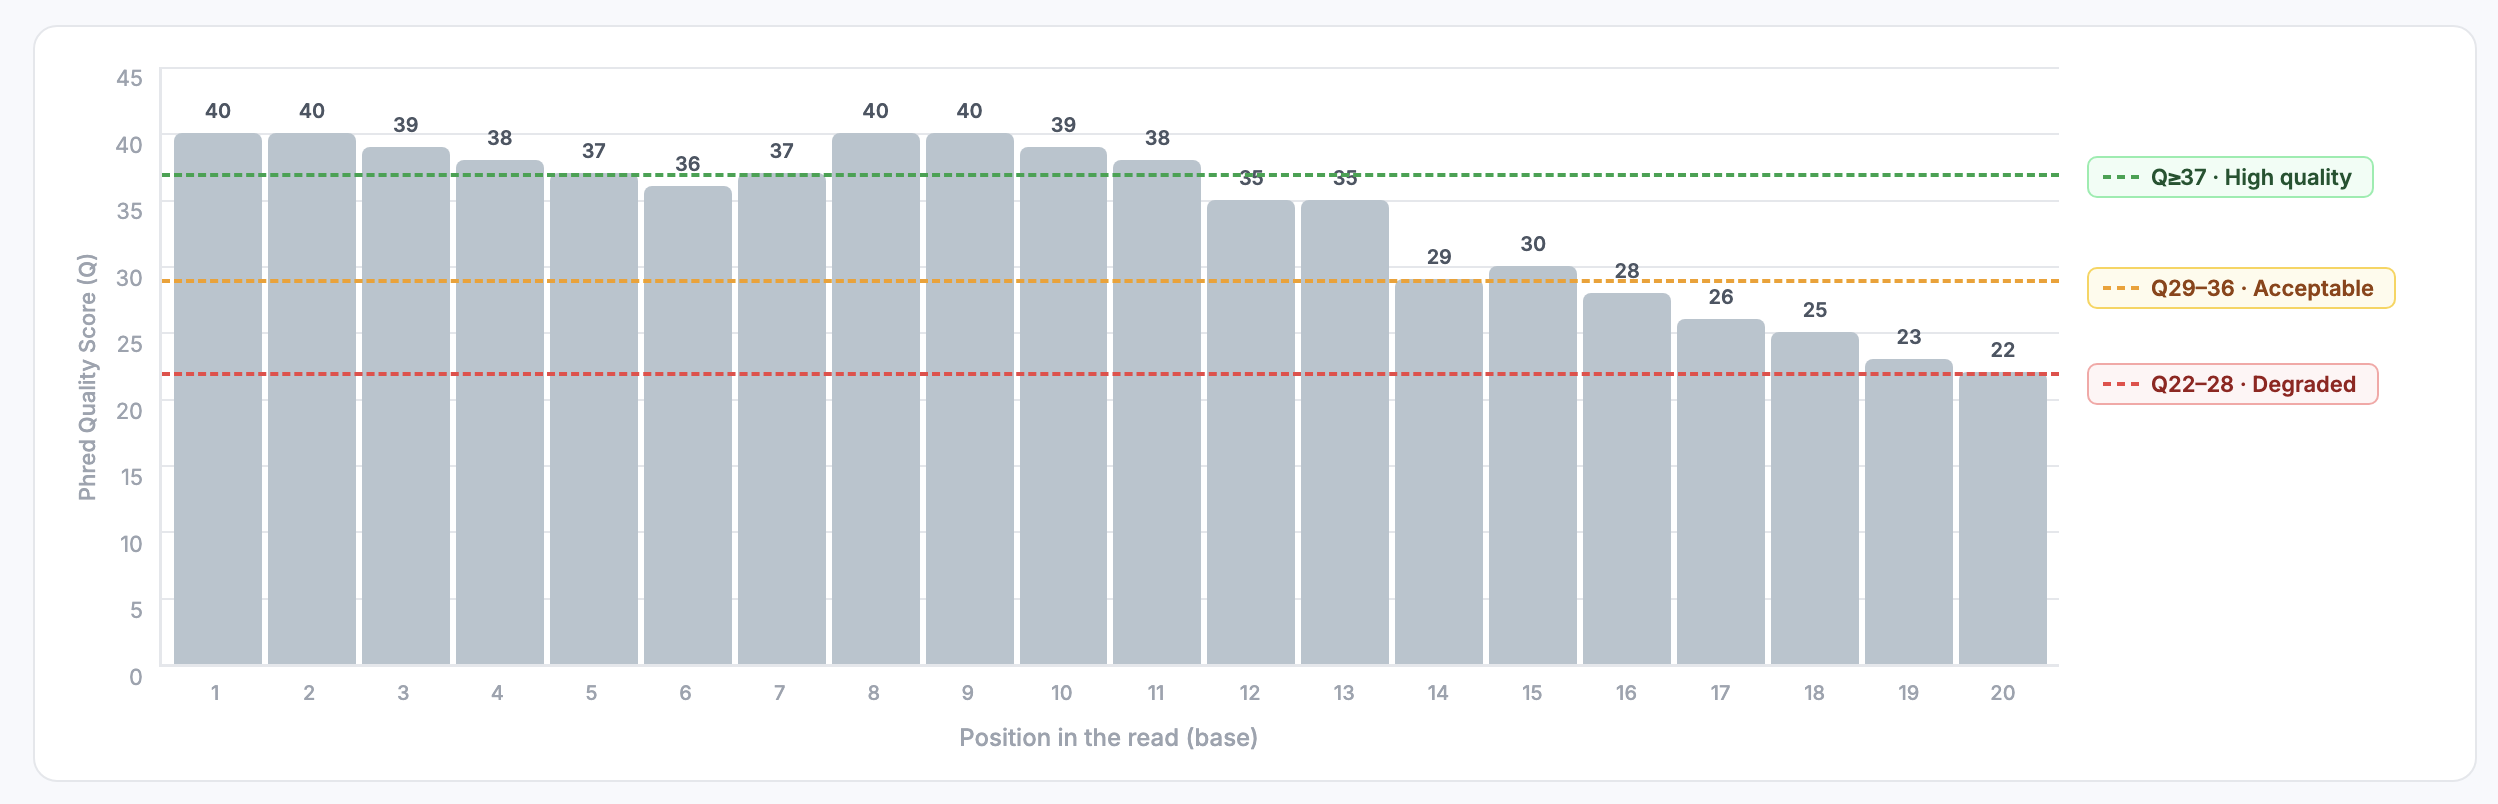
This pattern is common: high quality at the beginning, drop at the end. That is why trimming of the last nucleotides is often performed.
REVIEW
- FASTQ = raw data (bases + per-base quality).
- There is always at least one FASTQ file.
- If the experiment was paired-end, both strands were sequenced, resulting in two files (R1 and R2).
- If it was single-end, there will be only one file (R1).